About
 Niels Willems is currently a software architect at Synerscope B.V. in Helvoirt.
From 2007 till 2011, he was a PhD student in the Visualization group of professor Jack van Wijk at Eindhoven University of Technology.
His supervisor is Huub van de Wetering. We were involved in the Poseidon project of the Embedded Systems Institute investigating the system evolvability and reliability of systems of systems in favor of Thales Nederland B.V. and Noldus Information Technology B.V.. In this project, we focused on visualization of anomalies in maritime safety and security (MSS) systems.
On this page you find a brief overview of Niels' PhD research and his main publications. You can download his PhD Thesis here.
Contact
dr. ir. Niels C.M.E. Willems
Email: 
![]()
![]()
Research
Visualization of vessel trajectories for maritime safety and security systems
The sea seems an open playground, but regulations hold, and furthermore, safety (collision prevention) and security (threat prevention) need to be ensured. Operators monitor the coast using a Maritime Safety and Security (MSS) system, which allows analysis of multiple heterogeneous data sources. We aim at visualization methods to support operators to react on dangerous situations. To detect abnormal behavior, it has to be known what normal behavior is. As a first step, we start with visual exploration of trajectories of large vessels obtained by the AIS system.
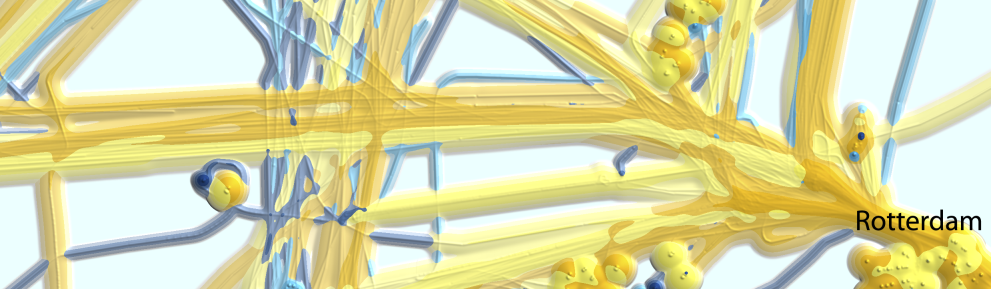
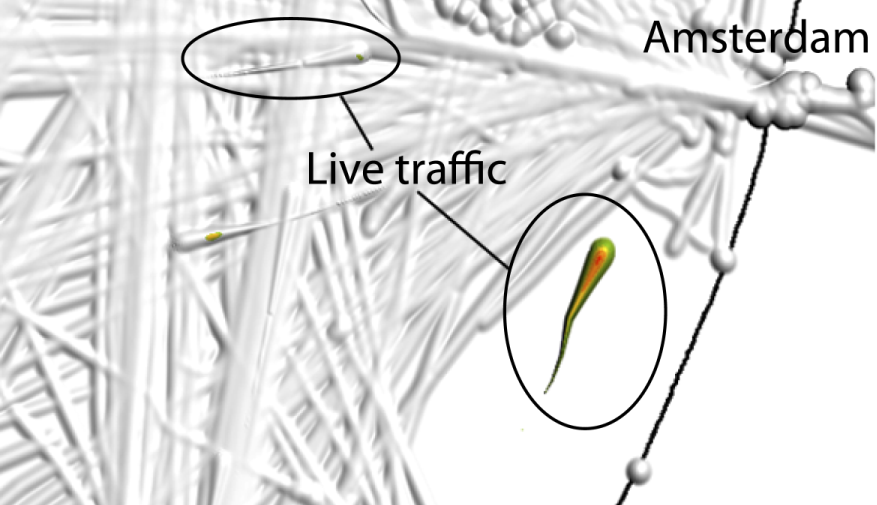
Vessel density
Trajectories are convolved by moving a kernel with the speed of the vessel along the path. We compute the density with both a small and large kernel and show them simultaneously in the shading of a colored height field. The large kernel shows an overview of maritime highways and the small kernel reveals slow moving vessels, which typically occur in zones before the harbor where ships drop anchor. An interesting location is the entrance of Rotterdam harbor. On the left, earlier work of the Dutch Ministry of Transport is shown where ships observed from an airplane are convolved. The poster is constructed with about 8000 data points during 3 years. On the right, our new method shows millions of data points during one week of shipping movement. The image shows that captains nicely obey the maritime rules.
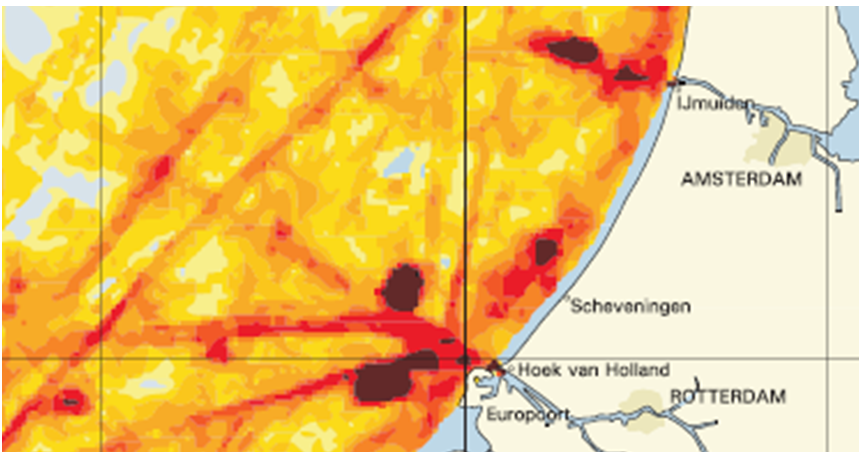

More info: Visualization of Vessel Movements, Niels Willems, Huub van de Wetering, and Jarke J. van Wijk, Computer Graphics Forum (Proceedings of EuroVis 2009), vol. 28, no. 3, p. 959-966, 2009. 
Multi-source analysis
The data broadcasted with AIS may not be rich enough in the number of different attributes to find (spatio-temporal) patterns in trajectory data. By representing trajectories in a knowledge base, we are able to incorporate contextual information from the (semantic) web and use Prolog reasoning to annotate trajectories with higher level behavioral patterns. With these techniques we are able to detect ships that moor at harbors where they not supposed to moor. We do this by matching the ship type information from AIS and the web, and contextual information about the harbor from the web using Prolog rules. Artificial trajectories created with Presto enable us to verify the manually created Prolog rules. The annotations obtained from the web or by reasoning can be used next to the present knowledge to explore the attribute space with a multi-dimensional trajectory visualization.
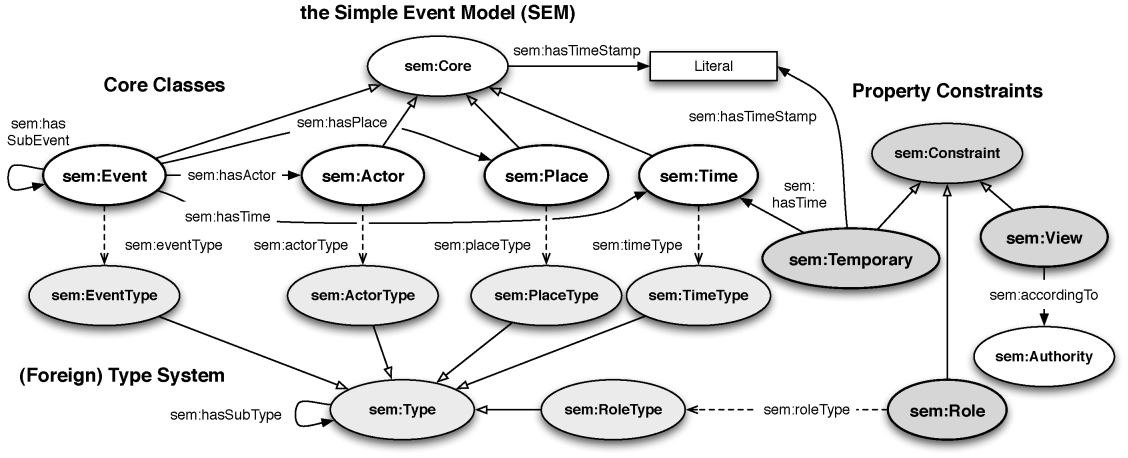
More info: An Integrated Approach for Visual Analysis of a Multi-Source Moving Objects Knowledge Base, Niels Willems, Willem Robert van Hage, Gerben de Vries, Jeroen H.M. Janssens, Véronique Malaisé, International Journal of Geographical Information Science, vol. 24, no. 10, p. 1543-1558, 2010.
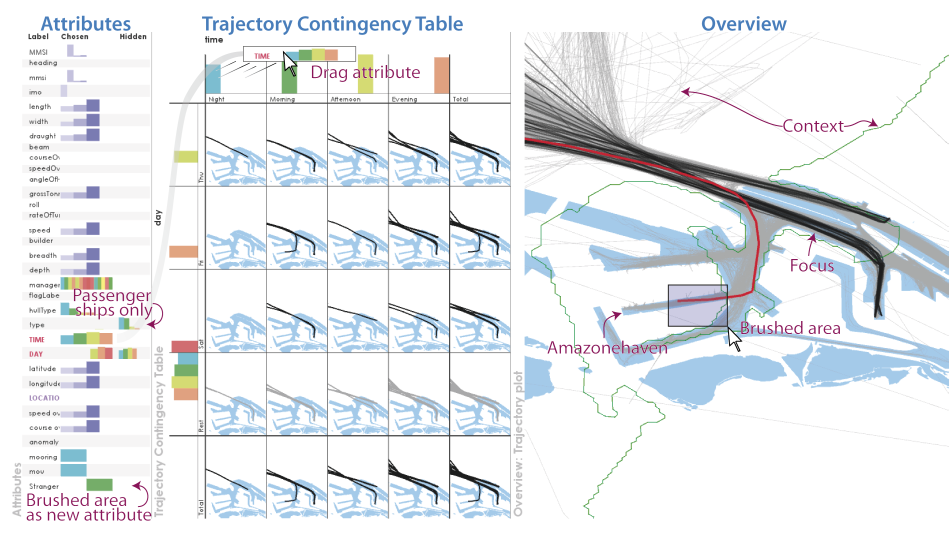
Multivariate density maps
Density maps are a generalization of vessel density, where attributes are taken into account in the computation and visualization of density fields. Multiple density fields are computed for parts of trajectories satisfying a filter criterium. The density fields are combined either into a new density field or the images of density fields are combined. Since the density fields are computed by means of graphics hardware, the density maps and their configurations can be explored interactively. In the publication, a number of relevant use cases are demonstrated showing the versatility of our method, including temporal aggregation, anomaly detection, and risk assessment maps.

More info: Interactive Visualization of Multivariate Trajectory Data with Density Maps, Roeland Scheepens, Niels Willems, Huub van de Wetering, and Jarke J. van Wijk, Proceedings of PacificVis 2011, p. 147-154, 2011
Interactive visualization in large scale comparative genomics
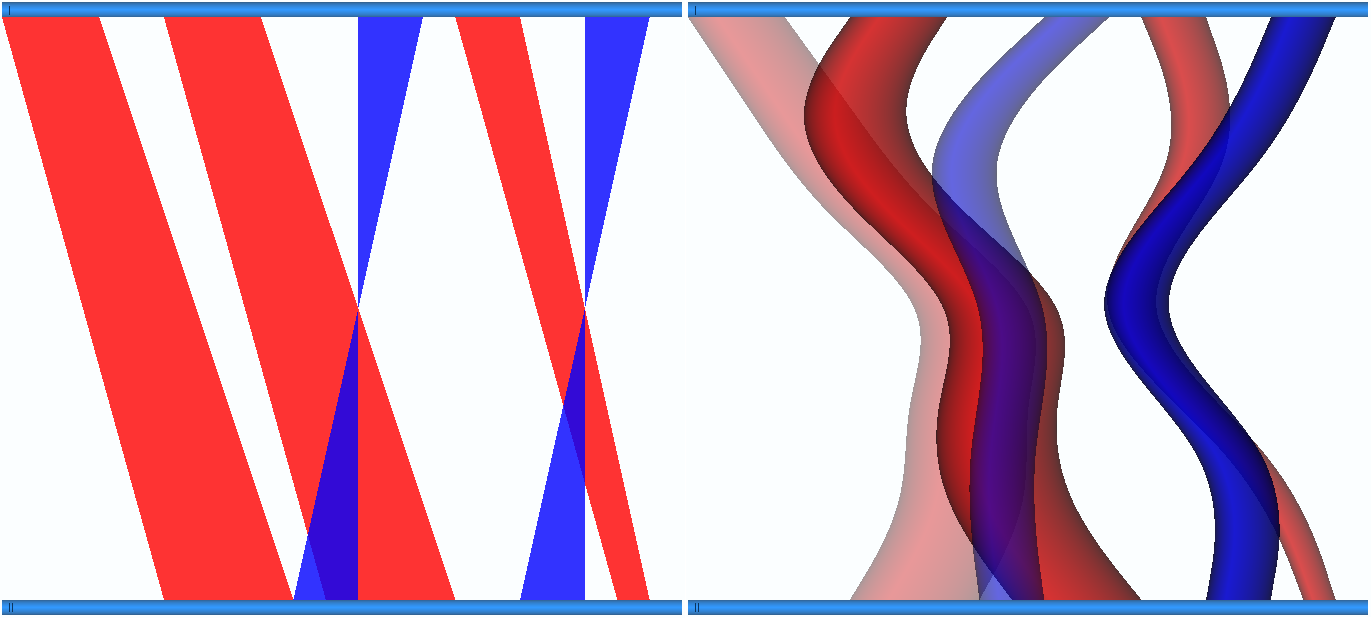 The genetic material of all organisms (DNA) is structurally and functionally equivalent. If two organisms share similar properties (phenotypes), these properties often derive from a common ancestor and are encoded similarly in the DNA. Comparative genomics is a molecular biological discipline searching for such similarities between DNA sequences as an indication of common ancestry and hence, a hint of similar function.
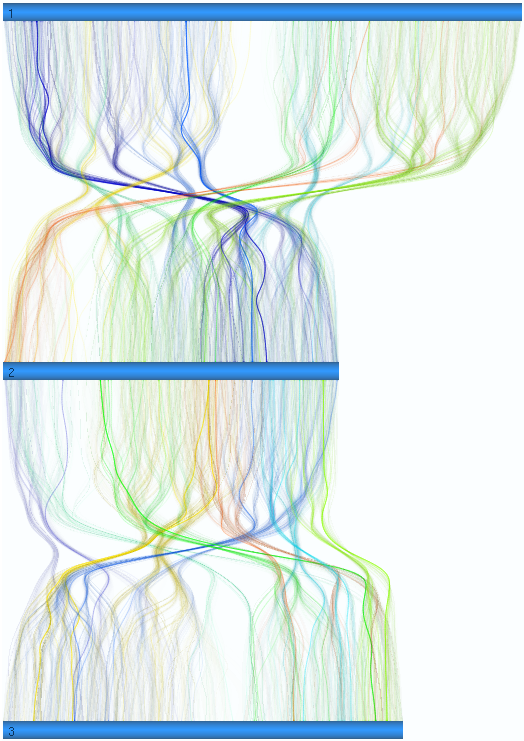
 The number of similarities between DNA sequences may be enormous and chaotically distributed. Besides, on large scale, individual similarities might be negligible small, but can be part of a much larger similarity.
A large set of similarities between DNA sequences of Arabidopsis thaliana is hierarchically clustered using various distance measurements to enable visualization using bundles. The result is an overview of dense locations of similarities, which current tools have problems to visualize. The overview of similarities can interactively be manipulated using the interactive DNAVis2 genome browser.
More info: Interactive Visualization in Large Scale Comparative Genomics, Niels Willems, Master's thesis, Eindhoven University of Technology, 2007.
Publications
Papers
- Visualization of Vessel Traffic, Niels Willems, Roeland Scheepens, Huub van de Wetering, and Jarke J. van Wijk, In Poseidon: Situational Awareness with Systems of Systems, Pierre van de Laar, Jan Tretmans, and Michael Borth, Eds., Springer, p. 73-87, 2013.
- Interactive Density Maps for Moving Objects, Roeland Scheepens, Niels Willems, Huub van de Wetering, and
Jarke J. van Wijk, IEEE Computer Graphics and Applications, vol. 32,
no. 1, p. 56-66, 2012.
- Composite Density Maps for Multivariate Trajectories, Roeland Scheepens, Niels Willems, Huub van de
Wetering, Gennady Andrienko, Natalia Andrienko, and Jarke J. van Wijk, IEEE Transactions on Visualization and Computer Graphics (Proceedings of InfoVis 2011), vol. 17, no. 12, p. 2518-2527, 2011.
- Evaluation of the Visibility of Vessel Movement Features in Trajectory Visualizations, Niels Willems,
Huub van de Wetering, and Jarke J. van Wijk, Eurographics Computer Graphics Forum (Proceedings of EuroVis
2011), vol.
30, no. 3, p. 801-810, 2011.
- Interactive Visualization of Multivariate Trajectory Data with Density Maps, Roeland Scheepens, Niels
Willems, Huub van de Wetering, and Jarke J. van Wijk, Proceedings of IEEE PacificVis 2011, p. 147-154, 2011.
- An Integrated Approach for Visual Analysis of a Multi-Source Moving Objects Knowledge Base, Niels Willems, Willem Robert van Hage, Gerben de Vries, Jeroen H.M. Janssens, Véronique Malaisé, International Journal of Geographical Information Science, vol. 24, no. 10, p. 1543-1558, 2010.
- An Integrated Approach for Visual Analysis of a Multi-Source Moving Objects Knowledge Base, Niels Willems, Willem Robert van Hage, Gerben de Vries, Jeroen Janssens, Véronique Malaisé, Geospatial Visual Analytics: Focus on Time, 2010.
- Visualization of Vessel Movements, Niels Willems, Huub van de Wetering, and Jarke J. van Wijk,
Eurographics Computer Graphics Forum (Proceedings of EuroVis 2009), vol. 28, no. 3, p. 959-966, 2009.
Posters
- Density Based, Visual Anomaly Detection, Roeland Scheepens, Niels Willems, Huub van de Wetering, and Jarke J. van Wijk, Workshop on Maritime Anomaly Detection, 2011.
- Multivariate Trajectory Selection, Niels Willems, Huub van de Wetering, and Jarke J. van Wijk, Workshop on Behaviour Monitoring and Interpretation, 2009.
- Vessel Density, Niels Willems, Huub van de Wetering, and Jarke J. van Wijk, Workshop on Behaviour Monitoring and Interpretation, 2009.
- Visualization of Vessel Trajectories for Maritime Safety and Security Systems, Niels Willems, Huub van
de Wetering, and Jarke J. van Wijk, IEEE InfoVis 2008, 2008.
Theses
- Visualization of Vessel Traffic, Niels Willems, Ph.D. Thesis, Eindhoven University of Technology,
2011.
- Interactive Visualization in Large Scale Comparative Genomics, Niels Willems, M.Sc. Thesis, Eindhoven
University of Technology, 2007.


Color map: Journal, Conference, Workshop, Thesis, and Miscellaneous.
An extended list of activities.
Links
Fellow visualization researchers
- Danny Holten
- Jing Li
- Hannes Pretorius
- Dennie Reniers
- Yedendra Shrinivasan
- Mickeal Verschoor
- Kasper Dinkla
- Roeland Scheepens
- Stef van den Elzen
- Martijn van Dortmont
Poseidon researchers
- Jeroen Janssens , Tilburg University
- Alberto González , Delft University of Technology
- Gerben de Vries, University of Amsterdam
- Daniel Trivellato, Eindhoven University of Technology
